Weekend Stock Market Outlook – August 18 2024

Stock Market Outlook entering the Week of August 18th = Uptrend
- ADX Directional Indicators: Uptrend
- On Balance Volume Indicator: Uptrend
- Institutional Activity (Price & Volume): Uptrend
ANALYSIS
The stock market outlook returned to an uptrend last Tuesday, after a very brief correction.
The S&P500 ($SPX) rose 3.9% last week. The index sits ~2% above the 50-day moving average and ~10% above the 200-day moving average.

All three signals show bullish action. On Balance Volume was the first mover, going green on Monday. After putting in a potential rally start on August 6th, institutional activity confirmed the move on Tuesday with a follow-through day. That flipped the signal and the outlook to an uptrend. The ADX confirmed the bullish move on Friday.

The Technology sector ($XLK) led the way last week, rising almost 8%! Real estate was the laggard ($XLRE), barely getting past break-even. The saying “a rising tide lifts all boats” applied last week, as the heavy hitters responsible for most of the movement in the overall index and outperformance was limited to just 2 sectors.

From a sector style perspective, Momentum, Large Cap, and High Beta tickers gained 5% or more, while high dividend and low beta tickers underperformed the general market.

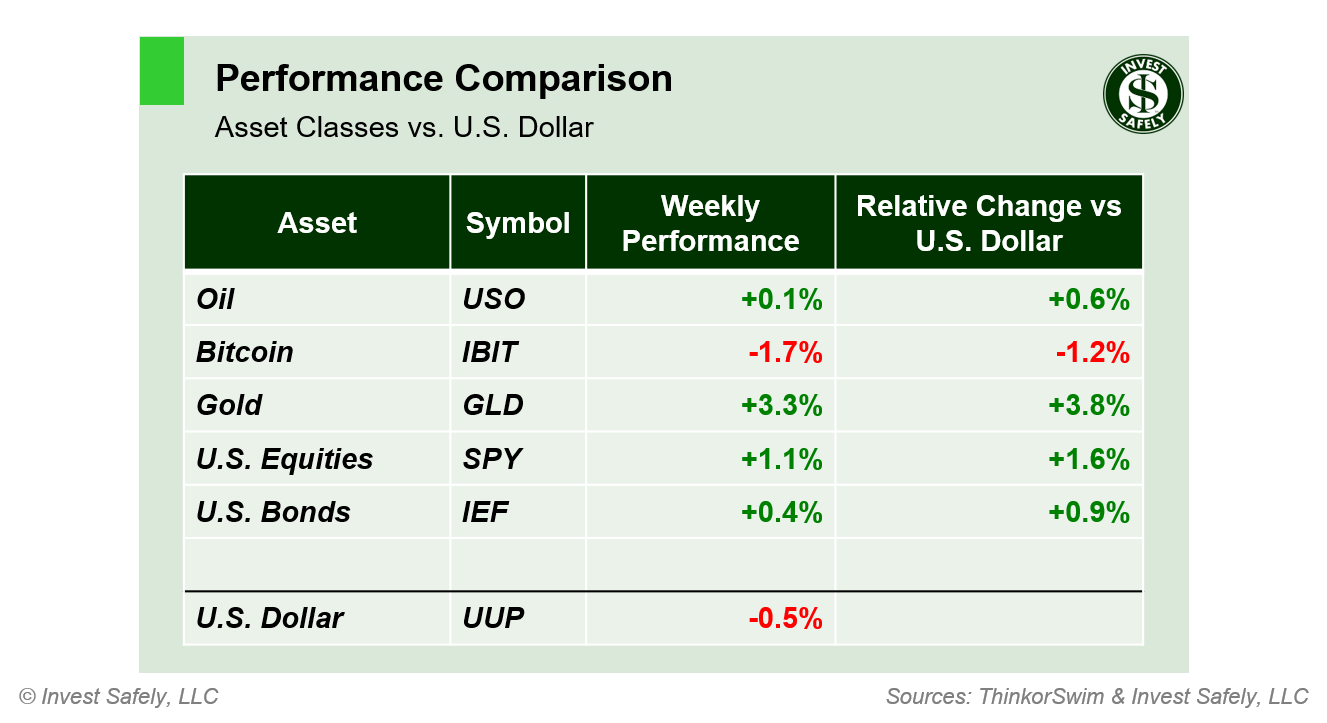
Gold led assets higher last week, benefiting from the weaker dollar, while Bitcoin led to the downside.
COMMENTARY
The volatility party ended as quickly as it started, with equities regaining most of their August sell-off and the $VIX back below 15. Just two weeks ago, the volatility index spiked to 65 and financial pundits were calling for emergency rate cuts. Seems like a year ago already; market time is a lot like dog-years in that sense.
July’s retail sales data came in better than expected at +2.7% y/y, thanks in part to automotive sales. And as expected, July Producer and Consumer price indexes showed further slowing of inflation, reflecting the lower levels experienced last summer. The consumer price index (CPI) fell for the fourth month in a row, down to 2.9% y/y in July, from 3.0% y/y in June.
| CPI (y/y) | Actual | Prior |
Expected |
| Headline | +2.9% | +3.0% | +3.0% |
| Core | +3.2% | +3.3% | +3.2% |
Producer prices (PPI) fell to 2.2% y/y in July, from June’s 2.7% y/y reading
| PPI (y/y) | Actual | Prior |
Expected |
| Headline | +2.2% | +2.7%* | +2.3% |
| Core | +2.4% | +3.0% | +2.7% |
August readings should benefit from the lower comparisons as well, but September through December will be more challenging.
This week is the Federal Reserve’s annual Jackson Hole symposium, with remarks from Chairman Powell scheduled for Friday morning. Otherwise, a fairly quiet week for macroeconomic data.
With the market outlook back in uptrend territory, capital flows should support higher prices. It’s not the time to get complacent though, as we were in almost the exact same position last August. Equity markets corrected to start the month, only to reverse higher heading into September. But that was the first of two head-fakes. Equities sold off again until early October, then rallied back to the 50-day moving average, only to head lower again…right up until the U.S. Treasury adjusted the bond allocations used for the Quarterly Refunding Announcement (QRA) and provided a rally catalyst.
Best to Your Week!
P.S. If you find this research helpful, please tell a friend.
If you don’t, tell an enemy.


