Weekend Stock Market Outlook – July 28 2024

Stock Market Outlook entering the Week of July 28th = Uptrend
- ADX Directional Indicators: Downtrend
- On Balance Volume Indicator: Mixed
- Institutional Activity (Price & Volume): Uptrend
ANALYSIS
The stock market outlook still shows an uptrend, though the mix of signals foreshadows a change in direction if the rotation out of mega-cap stocks continues.
The S&P500 ($SPX) lost 0.8% last week. The index now sits ~0.5% above the 50-day moving average and ~9.5% above the 200-day moving average. Buyers didn’t defend the 5500 level, through support did emerge near 5400.

The ADX shifts to a downtrend, reflecting the downward price action. On balance volume shows selling pressure as well, but remains bullish for now.
Institutional activity moves to mixed; 5 distribution days isn’t extreme, but higher than average trading volume on most down days adds to the bearish case. Buyers stepped in on Friday, but volume was lower relative the selling on Wednesday and Thursday.

Last week’s decline was limited to just a few sectors, again showing the impact of market concentration in the Mag 7 stocks. Tech was the worst sector ($XLK), while healthcare ($XLV) and materials ($XLB) led the way higher, just edging out financials ($XLF) and industrials ($XLI).

Sector Style Performance for Week 30 of 2024
Small caps led all sector styles…again. Large cap and momentum styles underperformed…again. The rotation out of Mag 7 names continued last week, as evidenced by the sector performance mentioned above.

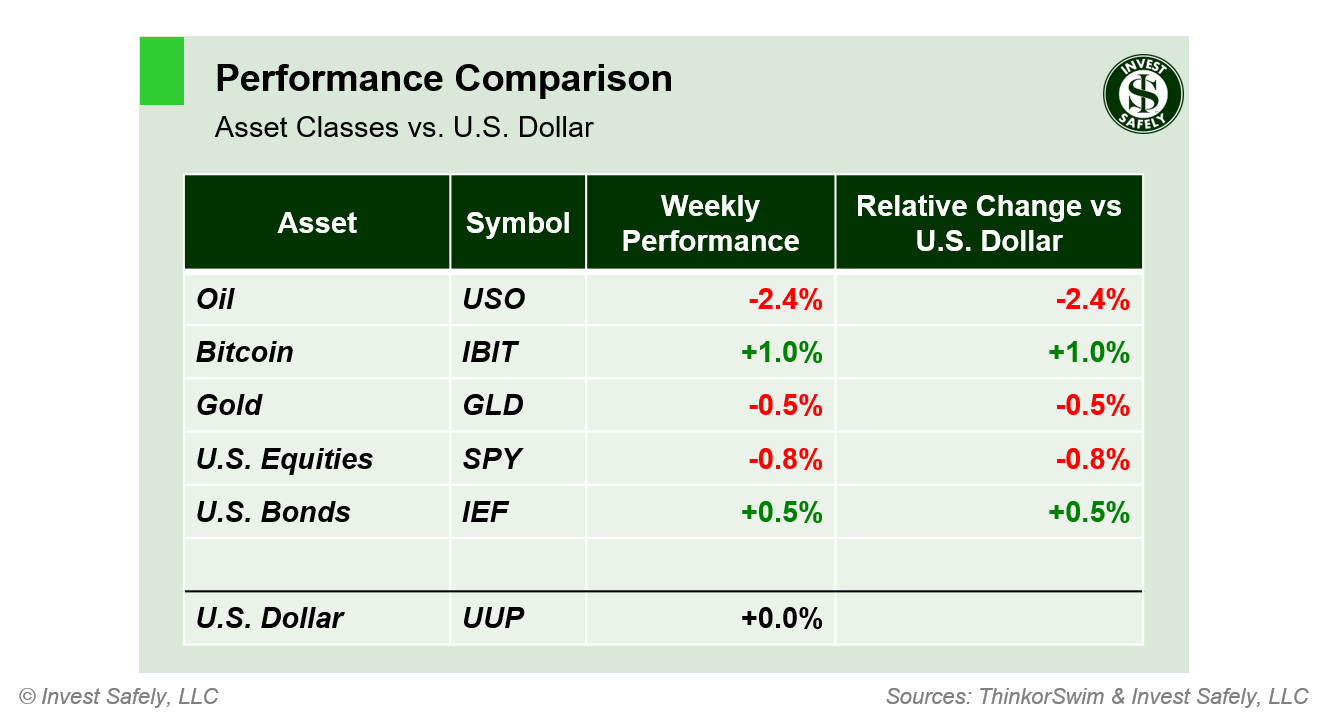
Bitcoin led to the upside, but nowhere near the double digit gain registered during the week of July 15th. Oil, which read through to commodities in general, declined the most.
COMMENTARY
As noted above, the last week’s losses weren’t evenly distributed, thanks to the market-weighting of Mag 7 stocks. The April low near 5000 was the last major support level for the S&P500, which also happens to be where the 200-day moving average is currently located. Just a reminder that there’s another 10% downside possible before we know if this is a garden variety correction or something more.
Look for more volatility this week, with another 4 of the Magnificent 7 releasing their latest quarterly earnings ($AAPL, $AMZN, $META, $MSFT).
Durable Goods orders cratered in June, falling 6.6%. A drop in orders for transportation equipment (automotive and aerospace) was the main culprit.
The first Q2 GDP estimate showed the economy expanded at an annualized pace of 2.8%, much higher than the final 1.4% figure in Q1. Most concerning is the increase in government spending at 3.1%, rising from 1.8%.
June PCE data showed a small increased month over month, but the yearly figures show inflation remains sticky. The Fed Fund futures market continues to predict rate cuts are eminent, which will be put to the test by the FOMC interest rate decision on Wednesday.
| PCE (y/y) | Actual | Prior |
Expected |
| Headline | +2.5% | +2.6% | +2.5% |
| Core | +2.6% | +2.6% | +2.5% |
Additional economic data due this week includes June JOLTs data on Tuesday, ISM Manufacturing PMI on Thursday, and July NFP on Friday.
Best to Your Week!
P.S. If you find this research helpful, please tell a friend.
If you don’t, tell an enemy.


